100 Days of Data Visualizations
Improving visualization engineering skills with d3, Vue, and React

| Languages: | JavaScript / HTML / CSS |
| Libraries: | d3.js, Vue.js, React.js |
| Data Source: | Various |
| Cost: | Free |
| Development Time: | Ongoing |
| Date: | July 2019 |
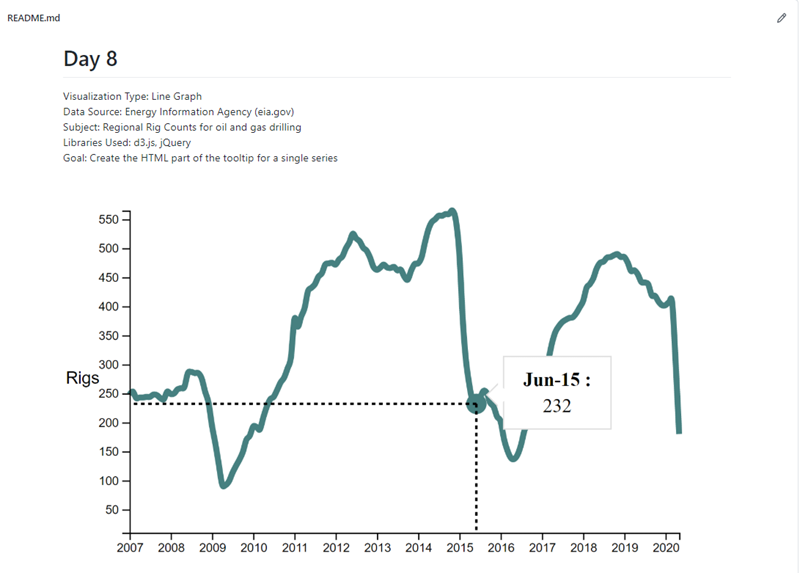
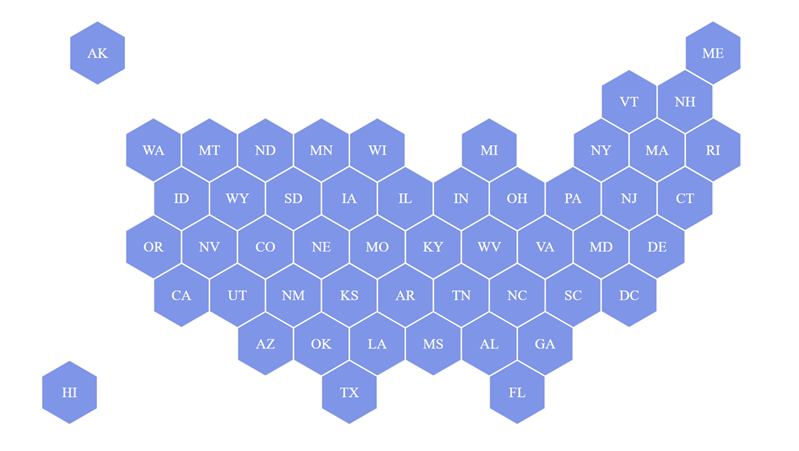
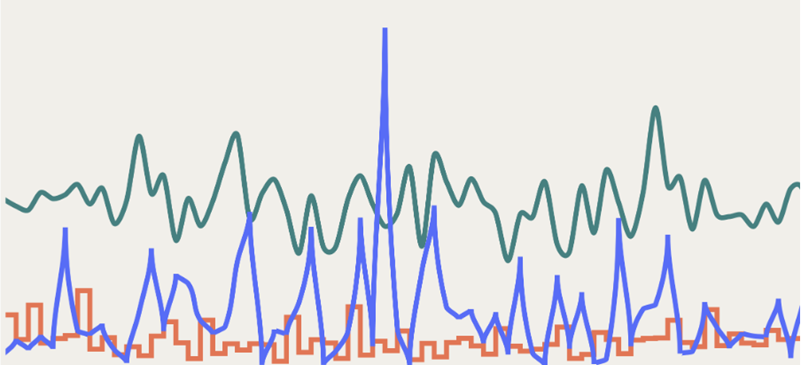
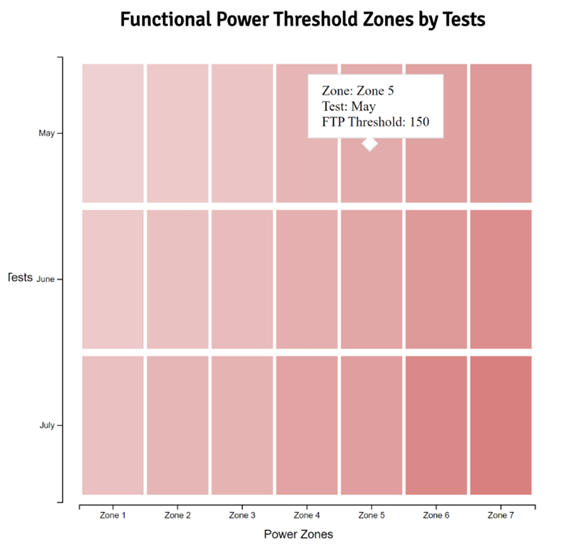
The goal of this project is to produce a new data visualization using d3, Vue, React or Seaborn for 100 days, and to experiment with as many new types of data visualizations as possible.
Links:


