Is the Met in the Money?
Analysis and Custom Data Visualizations
| Languages: | JavaScript / HTML / CSS |
| Libraries: | tui-charts, jQuery, raphael.js |
| Data Source: | Metropolitan Museum of Art Annual Reports |
| Cost: | $0 |
| Development Time: | 2 weeks |
| Date: | November 2019 |
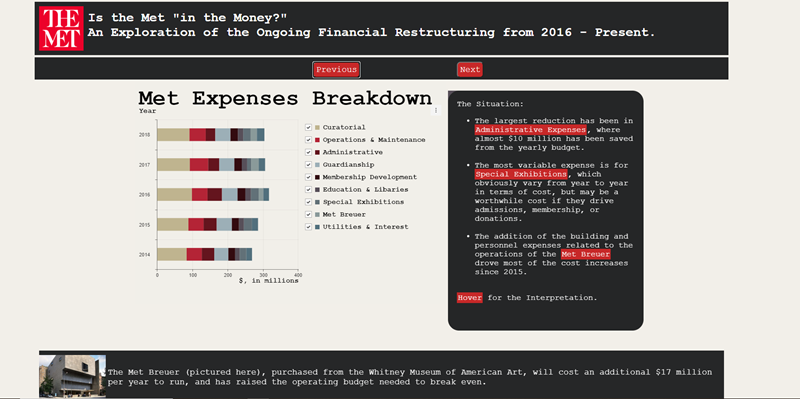
For my first interactive data visualization project in my graduate studio class, I performed an analysis of NYC's Metropolitan Museum of Art's financials as presented in their public annual reports and organized my findings as an interactive series of graphs and slides.
I used a library built on top of d3.js, called tui charts to create several interactive graphs that would allow users to explore the data as it is presented to them.
The aim of the project was to evaluate the success of the Met's efforts to restructure after being forced to rely heavily on its endowment for several years after the acquisition of the Breuer building from the Whitney Museum of American Art.