| Languages: | JavaScript / HTML / CSS / SQL |
| Libraries: | d3.js, Express.js, Node.js, PostgreSQL, AWS |
| Data Source: | Particle Wireless Temperature Sensor |
| Cost: | $60 |
| Development Time: | 1 month |
| Date: | December 2019 |
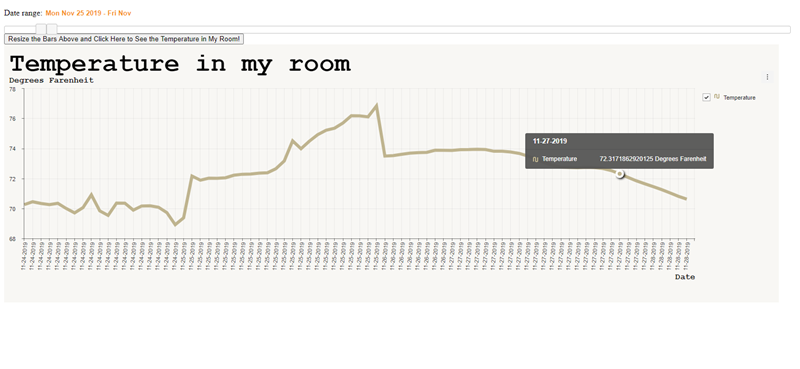
For a final project as part of the graduate work in my Data Structures class, I used a temperature sensor from Particle and some Arduino starter code provided by Particle to transmit temperature data from my room to my computer and record the temperature data in PostgreSQL database set up on AWS.
Using Express.js to set up a server that can retrieve data and reorganize the data, which was taking a temperature reading once every 30 seconds for over two months, I sent hourly averaged temperature readings to the front-end, where it was graphed using d3.js. User inputs were captured using the jQuery UI library to create a double-sided date slider so that a user could easily set a beginning and ending time index to query the data.
The use of several libraries was absolutely essential - in particular Moment.js to make sure the dates and times from the sliders were comparable to the dates and times being queried by the database.