| Languages: | JavaScript, HTML, CSS |
| Libraries: | Vue.js, d3.js, Node.js |
| Data Source: | SEC XBRL Files |
| Cost: | Free |
| Development Time: | 3 months |
| Date: | May 2020 |
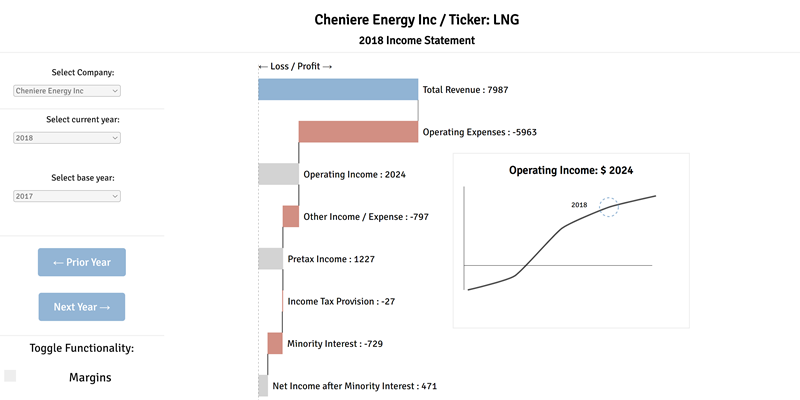
After scraping income statement data from SEC XBRL files using Node.js and saving the results to a series of JSON files, I created a user interface that enables users to explore profit and loss data for five companies (Cheniere Energy, Google, Facebook, Tesla, and Netflix) across five years of their filing history.
Using plain vanilla Vue.js in conjunction with many imported functionalities from d3.js, the resulting SVG interface allows for smooth visual transition from year to year. The visual design and code also accounts for years with significant losses as well as significant profits, and is designed for financial analysts to gain a quick understanding of a company's P&L for that year with only a glance.
This project has several planned updates in the months and years ahead, including plans for a balance sheet and cash flow statement series of visualizations, transitioning the project to Nuxt, incorporating Vuex for better state management capabilities, a mobile-first redesign of the SVG's, and moving all data to a back-end NoSQL DB like MongoDB or DynamoDB.